Lei Xie†, Yafeng Yin†, Xiang Lu†, Bo Sheng‡, Sanglu Lu†
†State Key Laboratory for Novel Software Technology, Nanjing University, Nanjing, China
‡Computer Science Department,University of Massachusetts Boston, US
Abstract: It is a tedious task to search and locate a specific food from a massive number of foods arbitrarily placed in a fridge. In this paper, we develop iFridge, an intelligent system which allows the user to effectively manage and accurately locate the foods stored inside the fridge. By leveraging the RFID technology, iFridge is able to automatically collect the food information, perceive the user's activities and locate the specified foods. We develop a smart application ``cooking recipe recommendation'' by sensing the user's daily eating habits. Moreover, by specifying those foods with roughly known locations as anchor nodes, we are able to locate the specified food by using cluster analysis.
Introduction
With the rapid development of ubiquitous services, RFID technology has nowadays been widely used in smart home system. In our daily lives, most people will find that it is a tedious task to search and locate a specific food from a massive number of foods arbitrarily placed in a fridge. Furthermore, it is usually difficult to recommend the right recipes according to the user's eating habits and the current foods in the fridge, since most users are not always well aware of their preference in daily diets. Fortunately, the proliferation of RFID technology has opened the way to skillfully solve the above problems.
In this paper, we develop iFridge, an intelligent system which allows the user to effectively manage and accurately locate the foods stored inside the fridge. By embedding the RFID system into the fridge, the foods attached with the RFID tags can be automatically identified. The food information can be collected for food management, e.g., showing the detailed information like the manufacturer, the production date and expiration date, and notifying the user when the expiration date is due.
Furthermore, by leveraging the RFID technology, iFridge is able to perceive the user's activities and locate the specified foods. Specifically, the eating frequency for each kind of food can be collected by monitoring the traces of the corresponding tags in the fridge. In this way, the user's eating habits can be further obtained according to the statistical analysis. We thus develop a smart application ``cooking recipe recommendation'' based on the activity sensing of the user's daily eating habits. Moreover, by specifying those foods with roughly known locations as anchor nodes, iFridge is able to locate the specified food by using cluster analysis, determining which compartment this food is most likely located in.
Demonstrations
-
System Design
-
Perception of User's Eating Habits through Activity Sensing
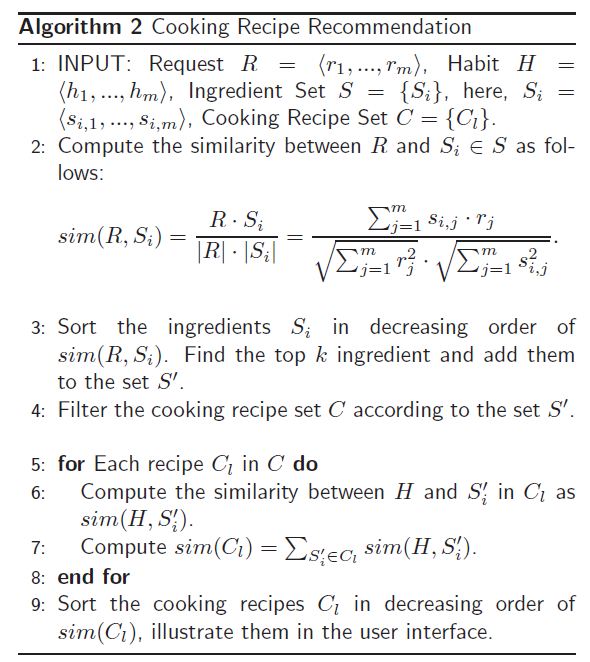
- Based on the above understanding, we have developed a smart application of "cooking recipe recommendation" for iFridge system. Algorithm 2 shows the detail processing logic for cooking recipe recommendation. In this application, the user can specify his/her eating preferences through the user interface, e.g., low in calories or high in fibre. After that, the corresponding cooking recipes are filtered according to the eating preferences, and then sorted and illustrated according to the user's daily eating habits. In this way, the cooking recipes are recommended to the users in a very humanized manner.
-
-
Algorithm 2 Cooking Recipe Recommendation
-
Accurate Localization with Cluster Analysis
The iFridge system is composed of an ordinary fridge, the RFID system and the tablet PC, as shown in Fig.1. In regard to the RFID system, we embed one Alien-9900+ reader and two Alien-9611 circular polarized antennas into the fridge. Besides, each food in the fridge is attached with an RFID tag. These RFID tags are Alien 9640 general-purpose tags, which contain the descriptions of the foods. A tablet PC is embedded into the surface of the fridge, working as the user interface of iFridge.

Fig.1. System Design and Real Deployment of iFridge
Fig.2 shows how the iFridge system works. The RFID reader periodically scans the tags inside the fridge through the antennas, collecting the food information from the tags' ID and on-board memory. Besides, the received signal strength from the tags can also be obtained as RSSI. These information is then transmitted from the reader to the tablet PC via the WiFi channel. By leveraging these information, the applications running on the tablet PC can effectively manage and accurately locate the foods in the fridge.

Fig.2. System Overview
Fig. 3 provides a software framework of iFridge to depict the interactions among the softwares. In this framework, the raw data including the tag ID and RSSI are continuously generated from the RFID system. In the tablet PC, the activity sensing module and the localization module respectively extract these raw data from the tags, and provide the information of activities and locations to the upper-layer applications.

Fig.3. The software framework of iFridge
The iFridge system supports two modes to monitor the tags' status inside the fridge. In the "continuous scanning mode", the RFID reader continuously scans the tags every once in a while, in the "event mode", the RFID reader starts to scan the tags only when the fridge is just closed. In both modes, by comparing the currently scanned tag set with the previously scanned tag set, the system can distinguish the foods being hitting the shelf and off the shelf, which are respectively corresponding to the newly identified tags and missing tags. If we denote the process of being hitting and off the shelf as one "transaction", the consumption frequency for each kind of food can be easily collected. Algorithm 1 shows the processing logic for activity sensing in event mode.
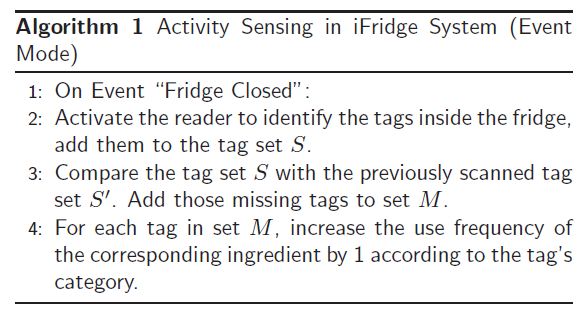
Algorithm 1 Activity Sensing in iFridge System
Furthermore, since the elements contained by each kind of food can be known in advance, the system can directly derive the user's eating habits according to the
use frequency for each kind of food. Table 1 provides an example which illustrates the elements contained by the foods. In this table, each kind of food can be measured with the quantities of the elements. In this way, the user's eating habits can be easily derived from the daily food. Fig.4 provides an example to derive the user's eating habits from the food frequency. According to the histograms, it can be found that foods with protein and lipid is more preferred by the user. On the other hand, some health guidance can be provided to the user in time.
Table 1: The elements contained by the foods: an example

Fig.4. Derive the user's eating habits from the food frequency
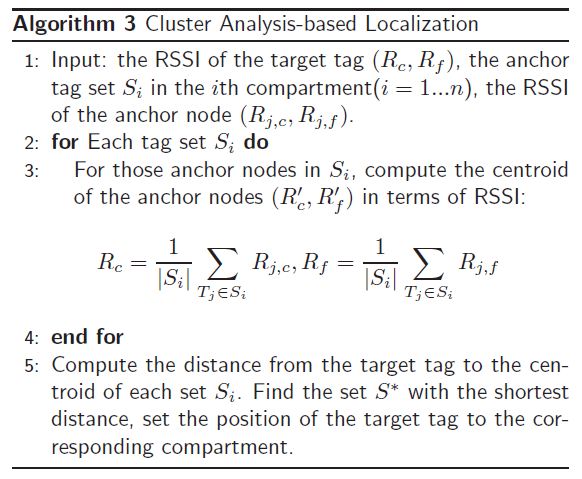
Nowadays it is still difficult to accurately locate a specific food from massive number of foods in a cost-effective approach. Fortunately, we find that the received signal strength of the RFID tag is very sensitive to the distance from the reader. Besides, since some foods are known to be placed in a fixed compartment, e.g., the ice cream must be laid up in the freezer compartment, it is possible to specify them as anchor nodes to assist localization. Therefore, we propose an accurate localization scheme in iFridge system, by leveraging the cluster analysis.
The objective of localization in iFridge is to determine which compartment the specified food locates in. According to the antennas respectively deployed in the ceiling and floor, the system can obtain the received signal strength (Rc,Rf ) of a certain tag from the two antennas. Therefore, by leveraging the RSSIs from those anchor
nodes, we are able to locate the specified food by using cluster analysis, as shown in Algorithm 3.
Algorithm 3 Cluster Analysis-based Localization
As two-compartment type refrigerator are conventionally used, we provide an example experiment result for case study, as Fig. 5 shows. We plot the RSSI respectively obtained from the antennas on the ceiling and the floor. Note that the anchor nodes in the bottom/top compartments all have similar properties in terms of RSSI. They form two clusters respectively for the bottom compartment and top compartment. Then, by comparing the distances from the target tags to these clusters, the position of these target tags can be easily located. Actually, according to the relative signal strength, we can further tell that target tag A locates in the upper layer in the bottom compartment while target tag B locates in the lower layer in the top compartment.

Fig.5. The user interface of Localization
Demo Video
The videos of our demonstrations could be downloaded from here: